Visualizing Data
All employees can use the data catalogue to search and discover environmental and scientific data. To begin, simply navigate to the Data Catalogue homepage and select a search type.
Overview
Geospatially enabled data in the data catalogue can be visualized using the interactive web map viewer feature.
Process
Discover > Combine Data/Select Data > Visualize
Before You Start
There are no conditions to using this feature. Anyone accessing the Data Catalogue can visualize geospatial data with the map viewer.
Discover
To begin visualizing geospatial data, simply locate the data using the data catalogue’s search functionality (for more information, see Discovering Data).
If a dataset can be visualized using the map viewer you will see two additional buttons: a globe or globe with drop down menu, and the pushpin with drop down menu.
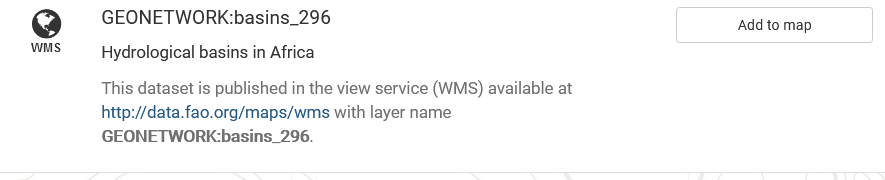
Add to map and view on map buttons
These allow you to:
view on map, which will open the selected dataset in the map viewer, or
choose layers to view on map, which will open the selected layers in map viewer, or
add the dataset to the Map, where you can combine multiple datasets to view in a single map.
View Data
To view a single dataset on the map viewer, simply click on the ‘View on map’ button for that dataset. The map viewer will open and display the data.
[screenshot of search result, arrow points to view on map button]
Combine Data
By adding datasets to the Map Preview you are able to overlay multiple datasets into a single viewer. This can be used to generate new insights and support decision making.
[screenshot of example displayed in map viewer]
Add datasets to the preview list by clicking the ‘Add to map list’ button (see pushpin icon) on each dataset from the search results page or metadata details.
[screenshot of search result and arrow to add to map preview button]
The ‘Add to map list’ with your selected datasets will display on the left-hand side of the search results page. At any time you can:
[screenshot of map preview list]
remove data you have added to the preview by clicking the X beside the title
combine and visualize the datasets by clicking ‘Add to map’. Click the ‘Map’ tab in the administration menu to view the results.
Visualize
Whether you have selected one or multiple datasets to visualize, the map viewer has a number of features to explore the data.
[screenshots of map viewer with expanded panel – ie) add layers, manage layers, etc]
Navigation Controls: located on the right hand side, change the viewing extent of the map;
add layers
manage layers
legend
filter data
use a WPS process
maps
print
measure
annotation
synchronize all layers
zoom in/out, zoom to extent
switch 2D to 3D
graticule